Not your parents’ technology bubble
Date 4 June 2021
Type Alternative Asset Management

Alantra Global Technology Fund (ALGTF ID Equity)
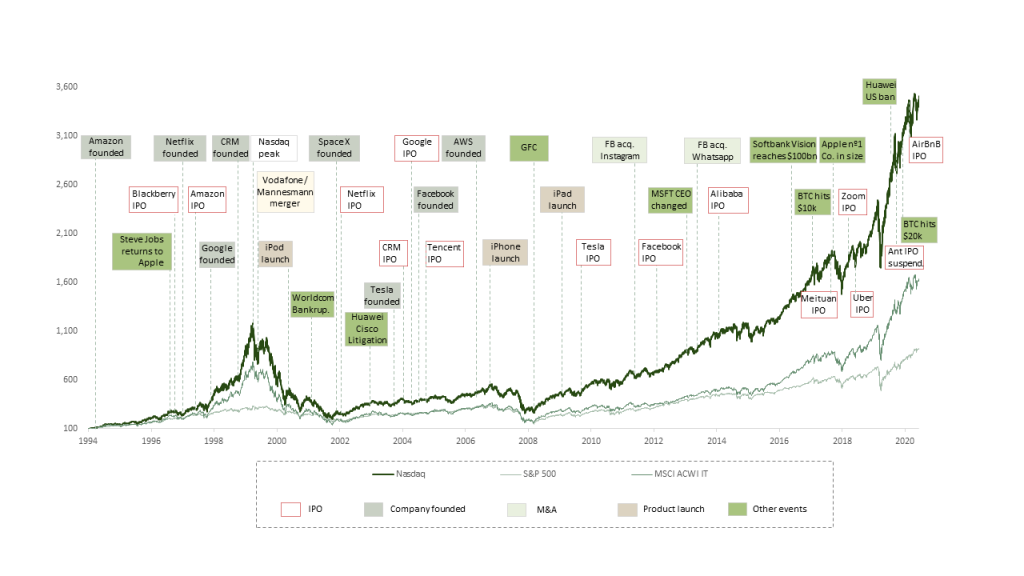
Now let us address the USD10tn elephant in the room. After a stellar 2020, we have seen a tougher period for growth and technology at least on a relative basis in recent months. It is hardly a surprise that casual observers fear we are seeing the beginning of bubble that is bursting. Indeed, even after recent moves, the Nasdaq sits pretty, well above 2000 levels. The software sector is cheaper than late last year, but trading on 15x forward revenues is hardly cheap. This not to mention the 400 special purpose acquisition companies (SPACs) chasing potential deals, many of which fall under the technology sector. Indeed, comparisons are often made between the surge in share prices last year with the dot.com mania and the crash of 2000. There is undeniably “froth” in the market, even if a bit less than last year. We see extremities in many ways. For example:
- Tesla’s valuation is still close to USD600bn, but it is valued more than the next nine biggest publicly quoted car companies combined. Airbnb is worth materially more than the 20 largest quoted hotel chains. Tesla and Airbnb still have a lot to prove in spite of their visionary managements, even though the former is making giant strides towards launching its autonomous Robotaxi fleet, while the latter holds a data and brand advantage on a global scale that is rarely seen in the travel industry.
- We have found that there are almost 30 companies that generate less than USD1m of annual revenues, valued anywhere between USD2bn and USD20bn.
- The recent retail interlude in markets also bears an uncanny resemblance to the participation in late 1990s, (we note, in certain markets, has reached 30% of market volumes). The subsequent short squeeze in certain share prices of course has added to volatility.
While we do detect degrees of excessive valuation in both public and private technology markets, we are also of the view that current valuations in technology sector are very different from the fundamentals seen in 2000 (something which is still fresh in our memory). In fact, we argue a clear distinction needs to be made between rampant speculation in certain areas and the significant, fundamentally sound technology industry. This could sustain market leadership for decades to come and make the risk of severe multiple contractions less likely.
Multi-decade themes in play. We believe there exists strong thematic tailwinds for growth at early levels of adoption in several areas, notably Digital Transformation, Electric Vehicles, Cybersecurity, Cloud, and E-Commerce. Growth of these areas, we believe, can be measured in decades as opposed to years and will benefit equally across the market capitalisation spectrum. It is for this reason that such themes account for 70% of the AGTF portfolio.
MFAANG franchises are solid, regulation permitting. Unlike in 2000, many of the more established technology companies are dominant global businesses with solid financial footing. Microsoft, Facebook, Apple, Amazon, Netflix and Google have all become giant companies with highly lucrative franchises in their chosen sectors, but their fates largely depend on other factors, such as government regulations. Although, with a combined $1.3tn in sales, EBITDA margins of 30% (on average), growth of 15% per annum and healthy cash piles, even increased levels of regulatory scrutiny may be enough to dent rather than stop such juggernauts.
Trends and themes post the pandemic are enduring, with a new generation of disruptors emerging. While the headlines have been dominated by share price volatility, we would note that almost six months in, we see signs of an acceleration in growth after the pandemic. We note that, recently, “Big Tech” reported surprisingly strong growth. The combined revenue of Alphabet, Amazon, Apple, Facebook and Microsoft jumped 41% in Q1 FY21 (to USD322bn), driving a 100% YoY growth in net income. This demonstrates a rapid acceleration in growth, even as they emerged to be part of the world’s largest companies. What we find most reassuring is that, from a thematic perspective, whether it is digital advertising, cloud computing, e-commerce or consumer internet services, we are in fact seeing faster growth than pre-pandemic levels. The share price reactions of these stocks have been more muted, which we think indicates issues around index concentration and/or regulatory concerns. One perspective that we ascribe to is that when such rapid growth at scale is possible, it is understandable why we are tempted to argue that the ‘next F.A.A.N.G’ may be under-valued (SE, SHOP among others belong to this group, with sizeable addressable markets and increasing competitive moats, in our view).

The relative of the sector has fallen back to its ex-TMT bubble norm, admittedly the 12-month forward P/E relative is one standard deviation above its ex-TMT bubble norm. However, the last time the sector reached similar levels, it continued to rerate significantly. Note that, in 2000, many companies went public with no earnings and just conceptual business models.

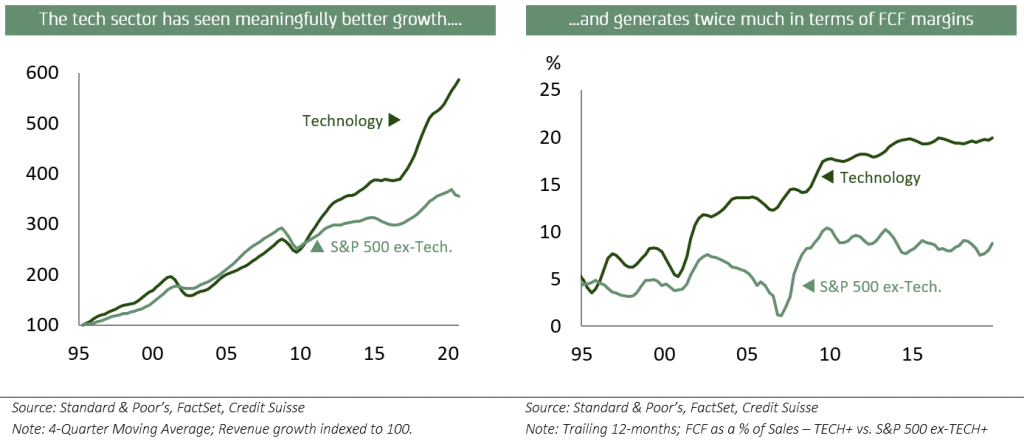
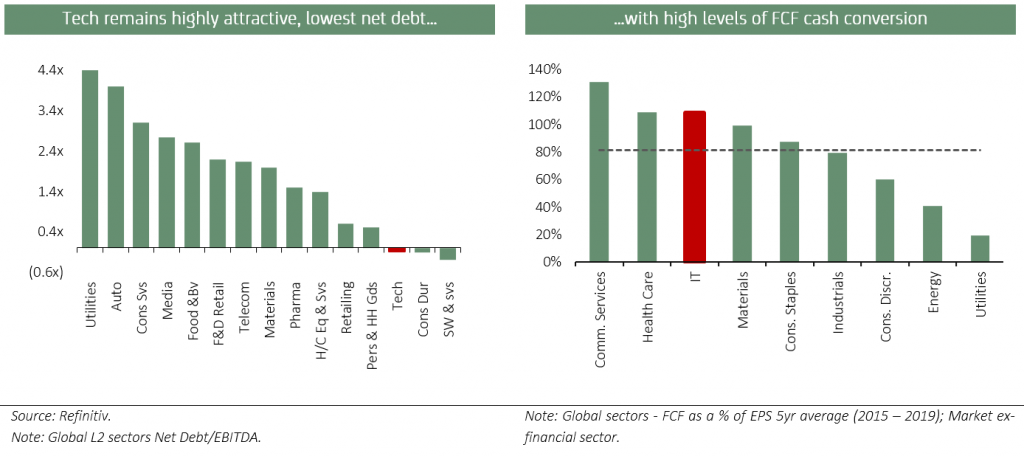
The technology sector has solid fundamentals, the strongest growth, profitability, and balance sheets. Within software, we expect healthy revenue growth of almost 30%, compared with a 6.1% growth expected in the broader S&P group. In fact, we believe software could account for 40% of incremental FCF growth of the entire S&P500 group in the coming years; in other words, it is now a major driver of the entire market and for good reason – digital transformation lies at the heart of every industry today. Moreover, across the sectors, as the charts above demonstrate, the sector drives superior revenue growth and FCF compared with the rest of the market, very different from the early 2000s.
- The tech sector is a strong driver of market growth and margins in the aggregate. As shown above, in aggregate, when we take a broader definition of technology, we observe revenue growth and profitability outside the sector far less attractive.
- High cash conversion means that the FCF yield remains reasonable at 3% for global IT and 3.6% for the top 20 names (2021 median adjusted for share-based compensation)

- Revenue estimates are in line with their trend and have not risen significantly above the rate of growth of CAGR of 10.2%. This is unlike the late 1990s, when sales rose to be c.12% above trend (compared with 0.1% now).
Conclusion. History teaches us that when sectors drive stock market leadership, they tend to dominate the market for 4 to 5 decades. For technology, this really started in 2000, implying there could be three decades of tech sector dominance yet to play out, in the same way the previous century saw real estate, industrials and financials dominating the market. Combining this with solid fundamentals, we believe this could be an opportunity for growth investors.
Alantra Global Technology Fund Team
*This article is an extract from the fund’s 2021 outlook letter. If you would like to be added to the fund’s distribution list contact [email protected]
This is article contains information (the “Information”) of Alantra Global Technology Fund (hereinafter, the “Fund”), a subfund of Canepa Funds ICAV, and it has been prepared by Alantra EQMC Asset Management, SGIIC, S.A. (hereinafter, “Alantra AM”). Alantra AM has not obtained an independent verification regarding the accuracy and integrity of the information used, nor a confirmation of the reasonability of the hypothesis considered. The Information has implicit subjective judgements. In particular, most of the criteria are based in estimates of the Fund’s future results. Considering the inherent uncertainties regarding any information concerning the future, some of these hypotheses may not materialize as defined.
The Information is not an offer to buy, sell or subscribe for securities or financial instruments and is not intended to be investment advice. Any decision to buy or sell securities issued by the Fund subject to this Presentation should be based on the legal documentation of the relevant Fund, in particular the subscription agreement and the prospectus of the Fund and the Key Investor Information Document (KIID) as it is filed with the applicable regulatory authorities from time to time, or on publicly available information on the related companies. The recipients of the Information must bear in mind that the securities or instruments discussed in herein may not be suitable for their investment objectives or financial circumstances, and past performance should not be taken as a guarantee of future performance. The Fund is an UCITS fund under the 2009/65/EC Directive.
In light of the above, neither Alantra AM, its officers, directors or employees, or its shareholders, may be held in any way liable for damages that could arise, directly or indirectly, as a result of decisions taken on the basis of this Information or any use given it by its recipients.
